Understanding Analytics
It’s important for you to know how people are interacting with your website.
There are a number of different metrics and tools you can use to measure how people are interacting with your website.
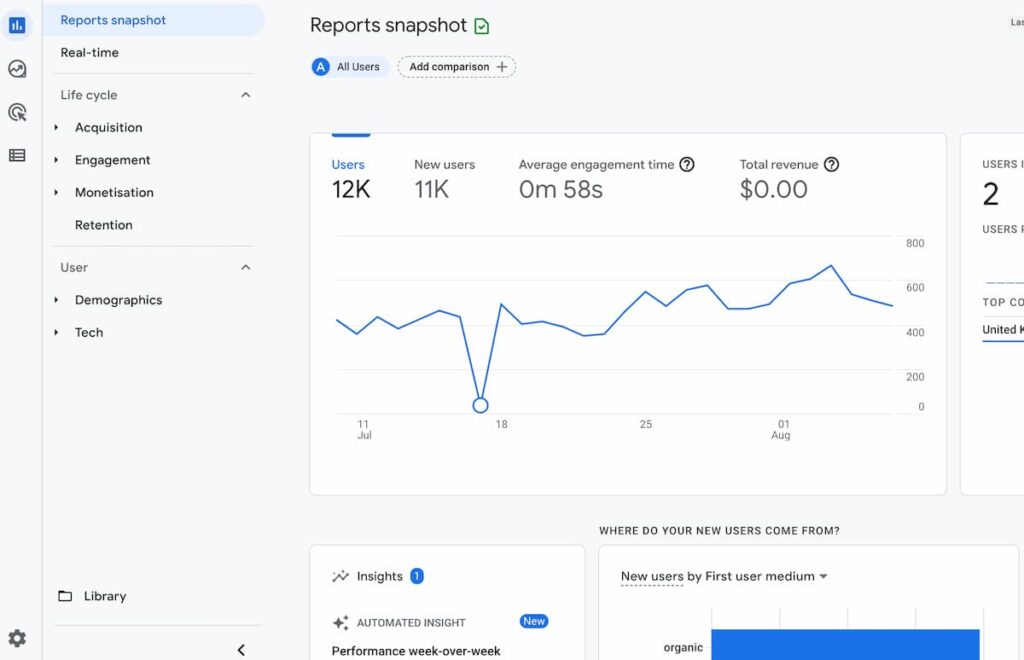
The most well-known of these is the free Google Analytics tool. Using Google Analytics, you can track metrics like the number of new and returning visitors to your site, how long they stay on your site once they get there, and whether they spend time browsing your site when they get to you or if they “bounce” straight off again.
All of these metrics are useful and relatively simple to interpret, but it’s important to note that they aren’t always black-and-white. A high bounce rate on a particular page, for example – meaning people arrive, read, then leave without going on to other pages on your site – isn’t strictly speaking a sign that there’s something wrong with your site. It’s possible that your visitors were just looking for information which they quickly found on your site, and that’s a good thing! On the other hand, if you’re an eCommerce site, a high bounce rate is a concern and a sign that you need to look carefully at what might be putting them off. You need to look at these metrics in conjunction with others and within the context of what kind of website you have and what you’re trying to achieve.
Using Google Analytics goals and events
What do you want visitors to do when they get to your site? Do you want them to have a read through your content then call you? Sign up to your newsletter? Browse through your online store and add items to their shopping cart?
Your goals will differ depending on what kind of business you have. Once you’ve thought through the questions above, you need to work out what would count as good “engagement” for your business website, and then track that activity (calls, purchases, newsletter sign-ups). This way you can analyse your marketing activity and the success of your website accordingly.
Google Analytics goals and events tools can help you measure the engagement activity that you consider important in your individual customer journey. Event tracking works by adding a piece of code or a tag to particular pages or buttons on your website, so you can measure how many people interact with them. In addition, you can set up custom user dimensions so that Google Analytics can divide these users into different groups and identify patterns of behavior which might be useful.
Heat maps and scroll trackers
While metrics like the above are useful, they can only show you so much when it comes to seeing exactly how people are using your website. Another way of looking at this is to use tools like heat maps and scroll trackers which let you see clearly what people are most attracted to on your pages.
Heat maps show you a representative “map” of your web pages, where red “hot spots” showing the spots people click on the most. These can help you visualise what people are most drawn to on a given page – sometimes it helps to see it laid out on the page instead of in numbers. It can be particularly useful if you have more than one call-to-action (CTA) on a single page – are visitors being distracted from doing what you really want them to by clicking on a secondary CTA?
Scroll trackers help you measure how far down your web page visitors are scrolling. Are they leaving before they even see your CTA? Is there something in particular that’s putting people off?


